New Cloud Security Stats, Trends Shared in the Q4 2015 State of the Internet – Security Report
 Akamai Technologies has announced the availability of the Q4 2015 State of the Internet – Security Report. The quarterly report provides analysis and insight into malicious activity observed across the Akamai Intelligent Platform and provides a detailed view of the global cloud security threat landscape. It can be downloaded at www.stateoftheinternet.com/security-report.
“The threat from DDoS and web application attacks isn’t going away. Each quarter, the number of attacks against Akamai customers continues to surge. This quarter, the number of web application attacks jumped 28% while DDoS attacks increased 40% compared with Q3,” said Stuart Scholly, Senior Vice President and General Manager, Security Business Unit, Akamai. “And malicious actors aren’t backing down. They’re hammering away at the same targets over and over again, looking for a moment when defenses may be down.”
During Q4, repeat DDoS attacks were the norm, with an average of 24 attacks per targeted customer in Q4. Three targets were subject to more than 100 attacks each and one customer suffered 188 attacks – an average of more than two per day.
DDoS attack activity at a glance
During Q4, Akamai mitigated more than 3,600 DDoS attacks across the routed solution, more than twice the number of attacks seen a year ago. The vast majority of these attacks were based on stresser/booter-based botnets. These DDoS-for-hire attacks rely heavily upon reflection techniques to fuel their traffic, and aren’t as capable of generating large attacks. As a result, we saw fewer of the mega-attacks than we did a year ago. Also, stresser/booter sites typically have time limits on their use, which contributed to a decrease in the average attack duration to just less than 15 hours.
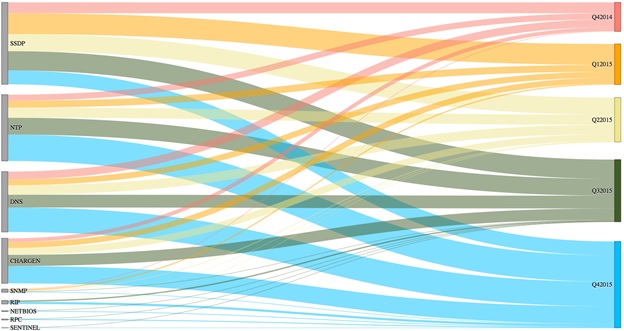
SSDP, NTP, DNS and CHARGEN have consistently been used as the most common reflection attack vectors, as can be seen on the left axis, and the use of reflection attacks has increased dramatically since Q4 2014, as shown on the right axis
Infrastructure layer (layers 3 and 4) attacks have dominated for several quarters, accounting for 97% of the attacks observed during Q4. Twenty-one per cent of DDoS attacks contained UDP fragments in Q4 2015. Some of this was a direct result of the amplification factor included in reflection-based attacks, primarily from the abuse of CHARGEN, DNS, and SNMP protocols, all of which have potentially large payloads.
The number of NTP and DNS attacks have increased dramatically compared to Q3. DNS reflection attacks increased 92% as malicious actors sought to abuse domains with built-in security (DNSSEC), since these usually offer larger response data. NTP, with an almost 57% increase, gained popularity over the previous quarter despite the fact that NTP reflection resources have been depleted over time.
Another trend is the increased use of multi-vector attacks. In Q2 2014, only 42% of DDoS attacks were multi-vector; in Q4 2015, 56% of the DDoS attacks were multi-vector. While most multi-vector attacks only used two vectors (35% of all attacks), 3% of the attacks observed in Q4 used five to eight vectors.
The largest attack of Q4 peaked at 309 Gigabits per second (Gbps) and 202 Million packets per second (Mpps). This attack targeted a customer in the software and technology industry and used an unusual combination of SYN, UDP and NTP attacks originating from the XOR and BillGates botnets. The attack was part of a sustained campaign in which the victim was targeted 19 times over an eight-day period, with additional attacks following in early January.
More than half of the Q4 attacks (54%) targeted gaming companies, with another 23% targeting the software and technology industry.
DDoS metrics
Compared with Q4 2014
- 148.85% increase in total DDoS attacks
- 168.82% increase in infrastructure layer (layers 3 & 4) attacks
- 49.03% decrease in the average attack duration: 14.95 vs. 29.33 hours
- 44.44% decrease in attacks > 100 Gbps: 5 vs. 9
Compared with Q3 2015
- 39.89% increase in total DDoS attacks
- 42.38% increase in infrastructure layer (layers 3 & 4) attacks
- 20.74% decrease in the average attack duration: 14.95 vs. 18.86 hours
- 37.5% decrease in attacks > 100 Gbps: 5 vs. 8
Web application attack activity
While the number of web application attacks increased by 28% over the last quarter, the percentage of web application attacks sent over HTTP vs. HTTPS has remained relatively consistent for two quarters – 89% via HTTP in Q4 vs. 88% via HTTP in Q3.
The most frequently observed attack vectors for the quarter were LFI (41%), SQLi (28%) and PHPi (22%), followed by XSS (5%) and Shellshock (2%). RFI, MFU, CMDi, and JAVAi attacks comprised the remaining 2%. The relative distribution of the attack vectors over HTTP vs. HTTPS was similar, with the exception of PHPi; PHPi was seen in just 1% of the attacks over HTTPS.
Fifty-nine per cent of the Q4 web application attacks targeted retailers, vs. 55% in Q3. The media & entertainment and hotel & travel industries were the next most frequently targeted, with 10% of the attacks each. This represents a change from Q3, when the financial services industry was the second most-targeted industry (15% of attacks), compared with just 7% of the attacks this quarter.
Continuing a trend from last quarter, the US was both the main source of web application attacks (56%) as well as the most frequent target (77%). Brazil was the next biggest attack source (6%) as well as the second most targeted country (7%), which seems to be related to the fact that a large cloud Infrastructure-as-a-Service (IaaS) provider opened new data centers there. Since the opening of the data centers, Akamai has seen a large increase in the amount of malicious traffic coming out of Brazil, and specifically from the aforementioned data centers. Most of those attacks were against a Brazilian customer in the retail industry.
For the Q4 report, we identified the top 10 sources of web application attack traffic by ASN, and analysed the corresponding attack types, payloads and frequency. A description of 10 of the more interesting attacks – and their payloads, is included in Section 3.6.
Web application attack metrics
Compared with Q3 2015
- 28.10% increase in total web application attacks
- 28.65% increase in web application attacks over HTTP
- 24.05% increase in web application attacks over HTTPS
- 12.19% increase in SQLi attacks
Scanning and probing activity
Malicious actors rely on scanners and probing to perform reconnaissance on their targets before launching attacks. Using firewall data from the perimeter of the Akamai Intelligent Platform, our analysis showed the most popular ports for reconnaissance were Telnet (24%), NetBIOS (5%), MS-DS (7%), SSH (6%), and SIP (4%). The top three sources of scanning activity were all located in Asia, as determined by ASN. We also saw active scanning for reflectors to abuse, including NTP, SNMP, and SSDP.
By looking at the top reflection sources by ASN, we saw that the most heavily-abused network reflectors were in China and other Asian countries. While most SSDP attacks tend to be from home connections, NTP, CHARGEN, and QOTD are generally from cloud hosting providers where those services run. SSDP and NTP reflectors were the most often abused reflectors at 41% each, followed by CHARGEN (6%) and RPC (5%). SENTINEL and QOTD followed at 4% each.
Download the report
A complimentary copy of the Q42015 State of the Internet – Security Report is available for download at www.stateoftheinternet.com/security-report.
Download Infographic – Click HERE
About stateoftheinternet.com
Akamai’s stateoftheinternet.com shares content and information intended to provide an informed view into online connectivity and cybersecurity trends as well as related metrics, including Internet connection speeds, broadband adoption, mobile usage, outages, and cyber-attacks and threats. Visitors to stateoftheinternet.com can find current and archived versions of Akamai’s State of the Internet (Connectivity and Security) reports, the company’s data visualisations and other resources designed to help put context around the ever changing Internet landscape.
About Akamai
As the global leader in Content Delivery Network (CDN) services, Akamai makes the Internet fast, reliable and secure for its customers. The company’s advanced web performance, mobile performance, cloud security and media delivery solutions are revolutionising how businesses optimise consumer, enterprise and entertainment experiences for any device, anywhere. To learn how Akamai solutions and its team of Internet experts are helping businesses move faster forward, please visit www.akamai.com or blogs.akamai.com, and follow @Akamai on Twitter.


